Springing Forward Using Easter Data Analytics

When you’re part of a winning team, word gets around. As a non-profit, we’re beholden to a dedicated board of directors. We recently had our quarterly board meeting and I was basking in the glow of a successful report on RIViR. I was mid-bask, when it happened. One of our board members stepped into my glow. “I’m always surprised at the work your team is doing,” he said.
“We’re dedicated to the cause and here to serve in the fight against fraud, waste, and abuse,” I basked.
“Oh no,” he replied, “I meant the work you’re doing for the Claus’. It’s amazing how we work with organizations beyond FWA. Good job!”
He patted me on the back, and that’s when it hit me. The strong scent of fresh baked cookies. Dusted with cinnamon and nutmeg, I think. It’s March. What’s going on? My pocket buzzed.
I pulled out my phone and scanned the caller ID. It was her. I let the phone buzz one more time.
A tentative, “Mrs. C,” escaped my lips.
“Hiiii there, Wiiillll,” she asked with feigned innocence.
“Hi, there. Are you still on vacation?”
Easter Infographic“I’m calling on behalf of a friend of mine. They needed help and I recommended you.”
“Are you giving me a referral, Mrs. Claus?” I beamed.
“Yes, but don’t let it go to your head. It’s a new year, and giving up red meat for Lent won’t be enough to make the list.”
How did she know? “Yes, ma’am. How can I help?”
“I’ll merge you in with E.B.”
E.B.?
A cheerful, boisterous voice rang through the phone. I felt springy and a little bouncy just from hearing the voice.
“Hey, the Claus’ said you helped them with some data and delivery dilemmas and thought you could help,” E.B. stated.
“I’m,” I chuckled, “all ears.”
 You see, Easter is coming up and 95 countries celebrate the holiday worldwide. According to Statista, 81% of Americans celebrate Easter. That’s hundreds of millions of Americans eating chocolate bunnies, consuming candy, and decorating and hiding eggs. Think of all the food coloring.
“Yeah, Will,” E.B. continued, “95% of those celebrating are going to pick up something for the holiday. And, 53% of them are going to be eating candy. We’re not as big about the candy as Halloween, but we come second for candy holidays. According to numerator.com, we do more candy than Christmas! See where I’m going?”
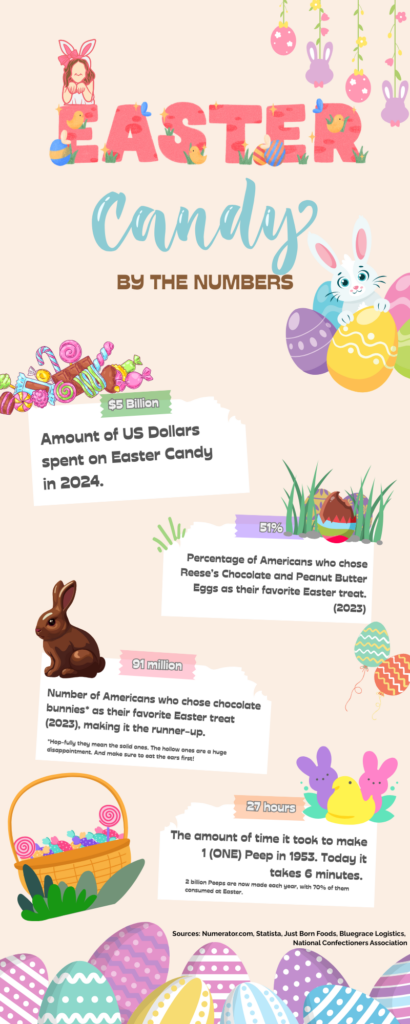
E.B. dropped big numbers. In 2024, $5 billion worth of Easter candy was consumed by girls, boys, parents, and grandparents.
“And guess what the big seller was, Will,” he sighed, “Reese’s chocolate and peanut butter eggs. Statista reported 51% of Americans choose it as their favorite Easter candy. Then came chocolate bunnies. I know, right? 91 million chocolate bunnies for Easter 2023 is second place, that’s not too bad.”
E.B. was having a logistics problem. “Not the same as the Claus’. We’re not into lists and what not, but we have these baskets. And people like to put their candy in these baskets. And about half of Americans give their kiddies small toys.”
E.B. needed to make sure candy, gifts, fake green grass, and the baskets holding these gifts were going to the right places.
“And don’t forget about the Hunt,” I was reminded. “If it’s nice outside, those baskets will see double use by kids hunting for eggs. We need to take the weather into account.”
I texted the team. They were excited and responded quickly.
With so many variables we suggested principal component analysis, or PCA. Many shipping logistics and distribution models use PCA to reduce the complexity of how geography, preferences (in this case chocolate peanut butter eggs or bunnies), gift preferences, health preferences, spending by locale, and more impact regions across the country. I told E.B. we could write a series of RIViR indicators after the reduction so they could plan for the quantities of baskets and goodies they’d need. PCA would be a first approach then we build simpler algorithms. But I had a question.
“Mr. Bu—“
“Call me, E.B., let’s keep it casual.”
“E.B. Uhhhhh, what about the Pee-“
“I know you have a thing about Peeps. Here’s the deal…2 billion Peeps are made each year, with 70% of them being consumed around Easter. In 1953, it took 27 hours to make one Peep. In the 21st century, a Peep rolls off the line in 6 minutes. Almost, 5.5 million Peeps are made each day. So, yeah, we can’t forget about the Peeps,” he closed. “I’ve heard you don’t eat them and only collect them. I’ll throw some in for you.”
I told E.B. we’d take the project on. Easter is floating holiday on the first Sunday after the first full moon. This year, it was on April 20th. E.B. is going to send historical data they’ve collected, we’ll do some initial analysis and run PCA in RIViR. That analysis will point us in the direction of algorithms to solve his problem. If you need logistics help or data analysis, we’re only a call away. Qlarant’s data and RIViR deployment teams will be on the case!
I wonder what kind of Peeps I’ll get Easter morning.
Sources: Numerator.com, Statista, Just Born Foods, Bluegrace Logistics, National Confectioners Association